
Docker Compose에 Prometheus를 추가하고 Spring Boot 메트릭 수집하기
연재 초반에는 Spring Boot Actuator에 /actuator/prometheus 엔드포인트를 열고, 메트릭 원문에서 카운터와 히스토그램을 읽었다. 이후에는 OTLP push 방식으로 Grafana Cloud에 메트릭을 보내 대시보드를 만들고 운영 환경에 적용하는 과정까지 정리했다.
다음 단계인 운영 알림은 임계값을 정할 기준선이 더 쌓여야 해 잠시 미뤘다. 그동안 아직 직접 확인하지 못한 Prometheus의 scrape 설정, relabel, recording rule이 어떻게 이어지는지 살펴보기로 했다. 운영 구성을 바꾸지 않고 로컬 통합 환경인 manyak-infra의 Docker Compose에만 Prometheus를 추가했다.
확인한 환경
이번 구성은 다음 환경에서 확인했다.
| 항목 | 환경 |
|---|---|
| Docker | 29.4.0 |
| Docker Compose | v5.1.2 |
| Prometheus | v3.13.2 |
| Spring Boot | 4.0.6 |
| Micrometer Prometheus Registry | 1.16.5 |
manyak-infra는 소스 코드를 직접 빌드하지 않고 GHCR에 배포된 manyak-server:dev 이미지를 실행한다. 서버 이미지에는 앞선 작업에서 추가한 Prometheus Registry와 로컬 전용 엔드포인트가 포함되어 있다.
운영 push와 로컬 pull 분리
운영과 로컬은 메트릭 수집 방향부터 다르다.
flowchart TB
    subgraph PROD["운영"]
        direction LR
        subgraph SERVER_PROD["서버 서비스"]
            PS["Micrometer OTLP Registry"]
        end
        PS -->|"OTLP push"| GC["Grafana Cloud"]
    end
    subgraph LOCAL["로컬"]
        direction LR
        subgraph SERVER_LOCAL["서버 서비스"]
            LS["/actuator/prometheus"]
        end
        PR["Prometheus"] -->|"HTTP scrape"| LS
    end
    PROD ~~~ LOCAL
운영에서는 /actuator/prometheus를 공개하지 않는다. 이 경로에는 JVM, HTTP 요청, 데이터베이스 커넥션 풀 같은 내부 상태가 포함되기 때문에 인증 없이 외부에 노출하면 안 된다. 공통 설정에서는 Prometheus export를 끄고 application-local.yml에서만 엔드포인트와 Registry를 활성화했다.
Docker Compose에서도 이 경계를 명시적으로 유지했다.
services:
  manyak-server:
    image: ghcr.io/kim-n-kang/manyak-server:dev
    environment:
      SPRING_PROFILES_ACTIVE: local
수집 엔드포인트는 로컬에서만 열리므로 Compose에서도 로컬 프로파일을 명시했다. 지금은 생략해도 로컬로 실행되지만 기본값이 바뀌면 앱은 떠 있어도 수집 요청만 404나 401로 실패할 수 있기 때문이다.
Docker Compose에 Prometheus 추가
docker-compose.yml에 Prometheus 서비스와 저장 볼륨을 추가했다.
services:
  prometheus:
    image: prom/prometheus:v3.13.2
    container_name: manyak-prometheus
    restart: unless-stopped
    command:
      - "--config.file=/etc/prometheus/prometheus.yml"
      - "--storage.tsdb.path=/prometheus"
    ports:
      - "${MANYAK_PROMETHEUS_PORT:-9090}:9090"
    volumes:
      - ./prometheus/prometheus.yml:/etc/prometheus/prometheus.yml:ro
      - ./prometheus/rules.yml:/etc/prometheus/rules.yml:ro
      - manyak-prometheus-data:/prometheus
    depends_on:
      manyak-server:
        condition: service_healthy
    healthcheck:
      test: ["CMD-SHELL", "wget -q --spider http://localhost:9090/-/ready || exit 1"]
      interval: 10s
      timeout: 5s
      retries: 5
      start_period: 10s
    networks:
      - manyak-network

volumes:
  manyak-prometheus-data:
    driver: local
이미지는 실행 시점마다 내용이 달라지는 latest 대신 v3.13.2로 고정했다. prometheus.yml과 rules.yml은 읽기 전용으로 마운트해 컨테이너가 호스트의 설정을 수정하지 못하게 했다.
수집한 시계열은 manyak-prometheus-data named volume에 저장한다. docker compose down으로 컨테이너를 내렸다가 다시 올려도 데이터는 남고 docker compose down -v를 실행하면 PostgreSQL 데이터와 함께 삭제된다.
Prometheus는 manyak-server가 단순히 실행된 시점이 아니라 healthcheck를 통과한 뒤에 시작한다. 서버가 준비되기 전에 스크레이프를 시도하면서 connection refused를 쌓는 것을 줄이기 위한 순서다. Prometheus 자체는 /-/ready를 호출해 설정을 읽고 요청을 받을 준비가 됐는지 검사한다.
호스트 포트는 기본 9090이며 .env에서 바꿀 수 있다.
MANYAK_PROMETHEUS_PORT=9090scrape와 relabel 설정
prometheus/prometheus.yml에 수집 주기, rule 파일, Spring Boot Target을 정의했다.
global:
  scrape_interval: 15s
  evaluation_interval: 15s

rule_files:
  - /etc/prometheus/rules.yml

scrape_configs:
  - job_name: manyak-server
    metrics_path: /actuator/prometheus
    static_configs:
      - targets:
          - manyak-server:8080
    relabel_configs:
      - target_label: environment
        replacement: local
      - target_label: service_name
        replacement: manyak-server-local
      - source_labels:
          - __address__
        regex: "([^:]+):[0-9]+"
        target_label: instance
        replacement: "$1"
메트릭 수집과 미리 정의한 집계식의 재계산은 각각 15초마다 실행하도록 설정했다.
Prometheus 컨테이너에서 localhost는 Prometheus 자신을 가리킨다. 같은 Compose 네트워크의 서버에는 Docker DNS가 제공하는 서비스 이름인 manyak-server로 접근해야 한다.
http://manyak-server:8080/actuator/prometheus반대로 호스트 브라우저는 Docker 내부 이름을 해석하지 못할 수 있다. 원본 메트릭을 직접 열 때는 게시 포트를 통해 http://localhost:8080/actuator/prometheus로 접근한다.
운영 데이터와 구분할 수 있도록 수집한 시계열에 로컬 환경을 나타내는 라벨을 붙였다.
environment="local"
service_name="manyak-server-local"
운영 Grafana Cloud의 OTLP 메트릭도 service_name을 사용한다. 로컬에서 같은 라벨 구조를 사용하면 PromQL을 비교하기 쉽고 값은 manyak-server-local로 구분해 운영 데이터와 혼동하지 않는다.
스크레이프 대상의 원래 주소는 내부 라벨 __address__에 manyak-server:8080으로 들어간다. 정규식 ([^:]+):[0-9]+에서 호스트 부분만 추출해 instance="manyak-server"로 바꿨다. 포트가 달라져도 같은 서버를 불필요하게 다른 시계열로 취급하지 않게 된다.
HTTP 요청률 recording rule
Spring Boot의 http_server_requests_seconds_count는 애플리케이션이 처리한 HTTP 요청의 누적 카운터다. 서버의 현재 부하를 보려면 누적값이 아니라 일정 구간의 증가 속도를 계산해야 한다.
rate(http_server_requests_seconds_count[5m])원본 메트릭은 URI, method, status, exception 같은 라벨 조합마다 나뉜다. 전체 서버 요청률을 만들기 위해 세부 시계열을 합산하고 반복할 PromQL을 prometheus/rules.yml에 recording rule로 저장했다.
groups:
  - name: manyak-server-local
    rules:
      - record: job:http_server_requests_seconds_count:rate5m
        expr: >-
          sum by (job, service_name, environment)
          (rate(http_server_requests_seconds_count[5m]))
Prometheus는 15초마다 이 식을 평가하고 결과를 job:http_server_requests_seconds_count:rate5m이라는 새로운 시계열로 기록한다. 이후에는 긴 PromQL을 다시 입력하지 않고 recording rule의 이름으로 조회할 수 있다.
설정 파일 검증
컨테이너를 올리기 전에 Compose가 환경변수와 YAML을 정상적으로 해석하는지 확인했다.
docker compose config --quietPrometheus 이미지에 포함된 promtool로 scrape 설정과 rule 표현식도 검사했다.
docker run --rm \
  --entrypoint /bin/promtool \
  -v "$PWD/prometheus/prometheus.yml:/etc/prometheus/prometheus.yml:ro" \
  -v "$PWD/prometheus/rules.yml:/etc/prometheus/rules.yml:ro" \
  prom/prometheus:v3.13.2 \
  check config /etc/prometheus/prometheus.yml
검사 결과 Prometheus 설정과 recording rule 하나가 모두 유효했다.
Checking /etc/prometheus/prometheus.yml
  SUCCESS: 1 rule files found
  SUCCESS: prometheus.yml is valid prometheus config file syntax

Checking /etc/prometheus/rules.yml
  SUCCESS: 1 rules found
Prometheus 실행
Prometheus와 필요한 의존 서비스만 실행했다.
docker compose up -d --wait prometheus브라우저에서 http://localhost:9090을 열자 Prometheus Query 화면이 나타났다.
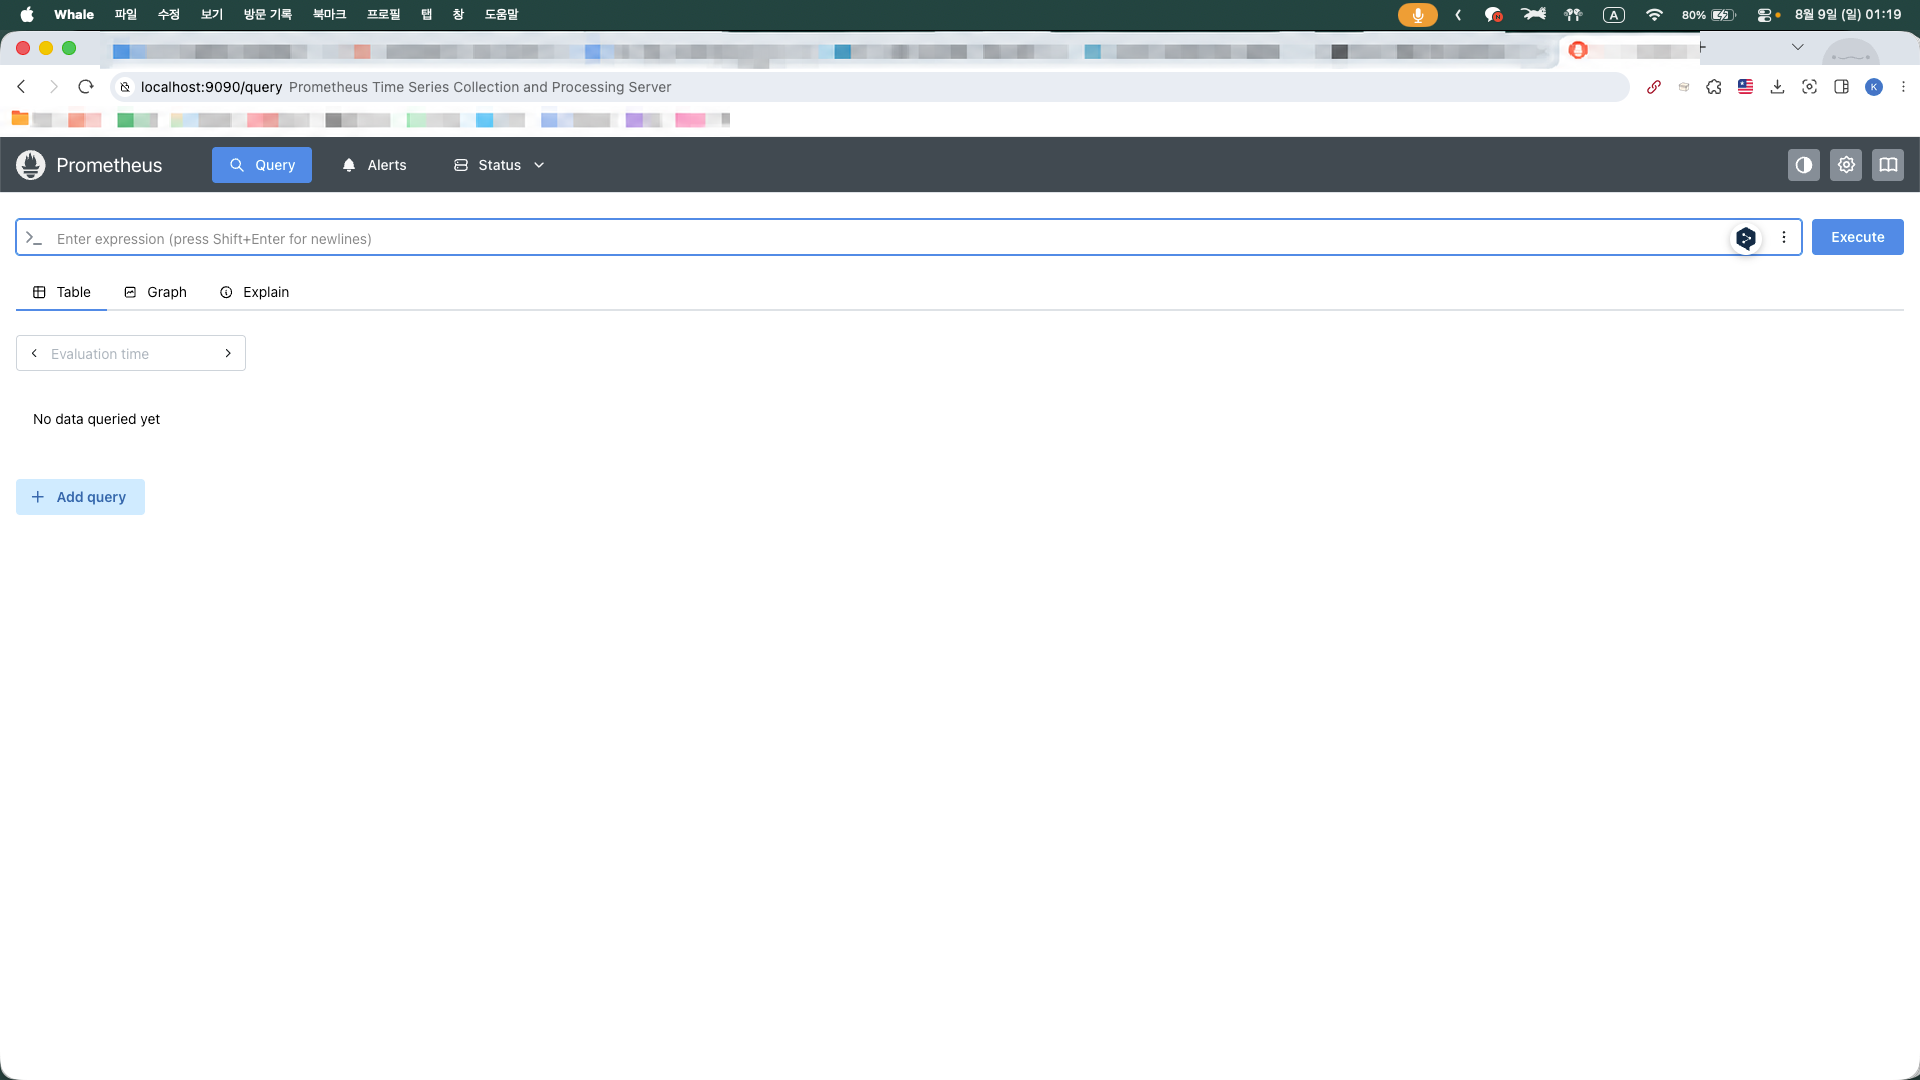
No data queried yet는 아직 PromQL을 실행하지 않았다는 뜻이다. Query 화면이 열렸다는 사실만으로는 Spring Boot 메트릭 수집까지 성공했다고 볼 수 없으므로 Target 상태를 따로 확인했다.
Target health 확인
Status → Target health에서 manyak-server가 1 / 1 up으로 나타났다.
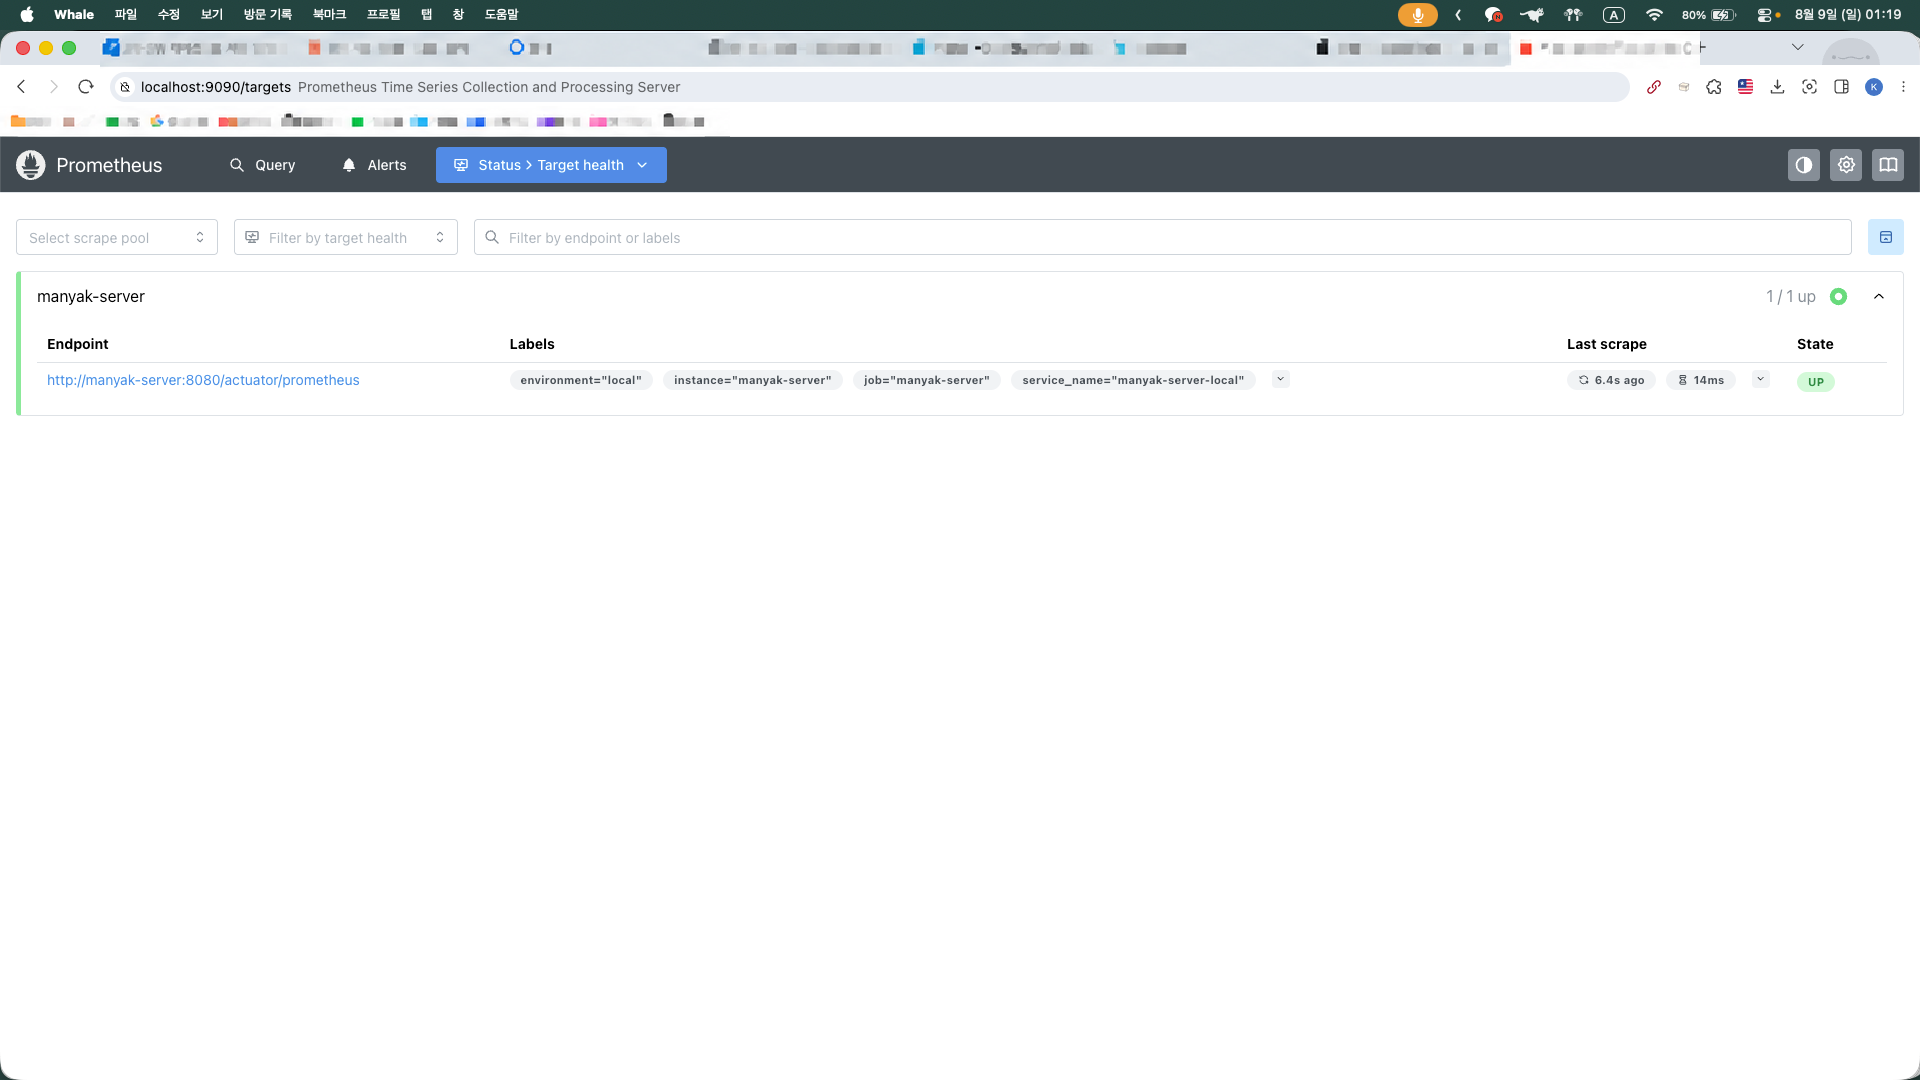
Endpoint는 http://manyak-server:8080/actuator/prometheus이고 State는 UP이다. 마지막 스크레이프 시점과 요청 소요 시간도 계속 갱신됐다. Prometheus가 설정 파일을 읽었고 Docker 네트워크에서 서버를 찾았으며 메트릭 원문을 정상적으로 파싱했다는 뜻이다.
화면의 라벨도 relabel 설정과 일치했다.
environment="local"
instance="manyak-server"
job="manyak-server"
service_name="manyak-server-local"
화면에 표시된 Endpoint 링크는 Docker 내부 주소라 호스트 브라우저에서 직접 열리지 않을 수 있다. Prometheus 컨테이너 안에서 이 주소로 접근할 수 있으면 Target 수집에는 문제가 없다.
up 메트릭 확인
Prometheus는 스크레이프 성공 여부를 up이라는 자체 메트릭으로 기록한다.
up{job="manyak-server"}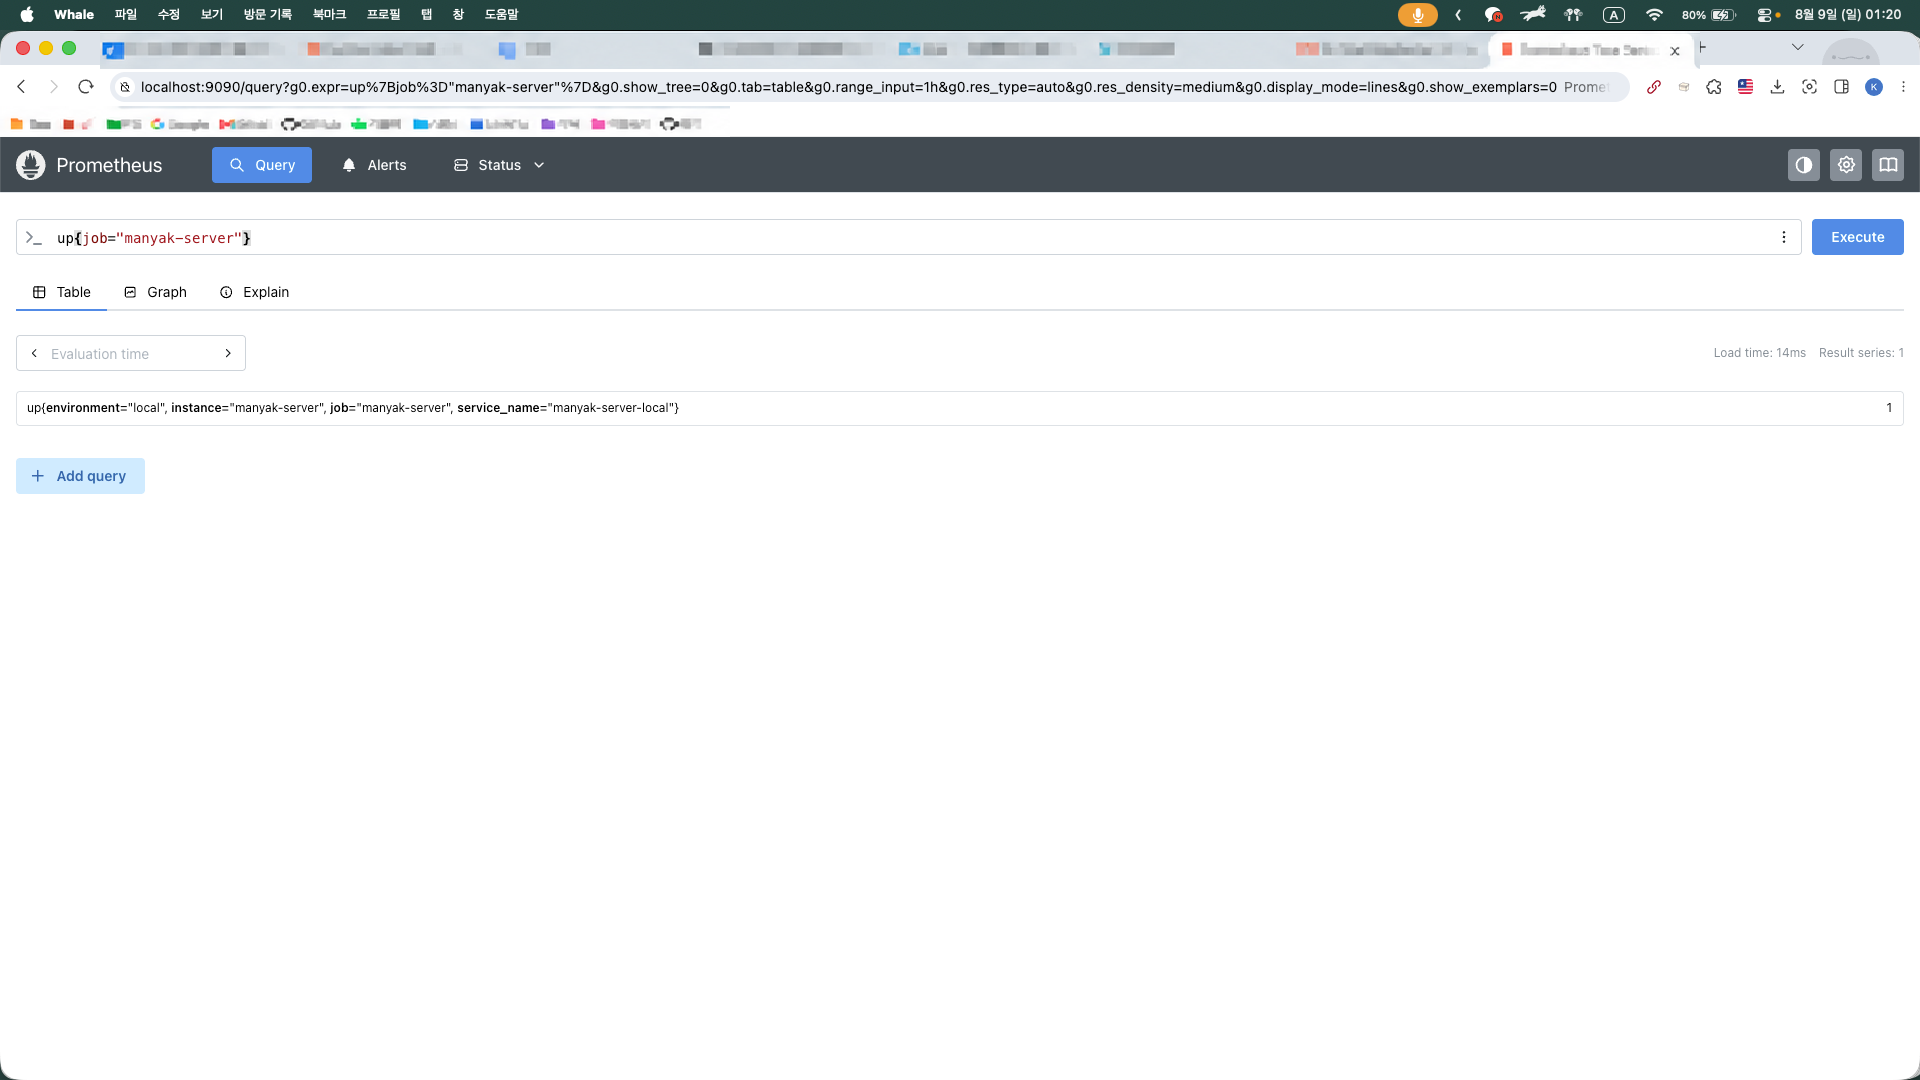
결과값 1은 마지막 스크레이프가 성공했다는 의미다. 대상에 접근하지 못하거나 응답을 파싱하지 못하면 값이 0이 된다. Target 화면의 UP과 PromQL의 1은 같은 상태를 UI와 시계열이라는 서로 다른 경로로 확인한 결과다.
recording rule 결과 확인
최소 두 번 이상 스크레이프한 뒤 recording rule 이름을 조회했다. rate는 두 시점의 카운터가 있어야 증가량을 계산할 수 있다.
job:http_server_requests_seconds_count:rate5m{
  service_name="manyak-server-local"
}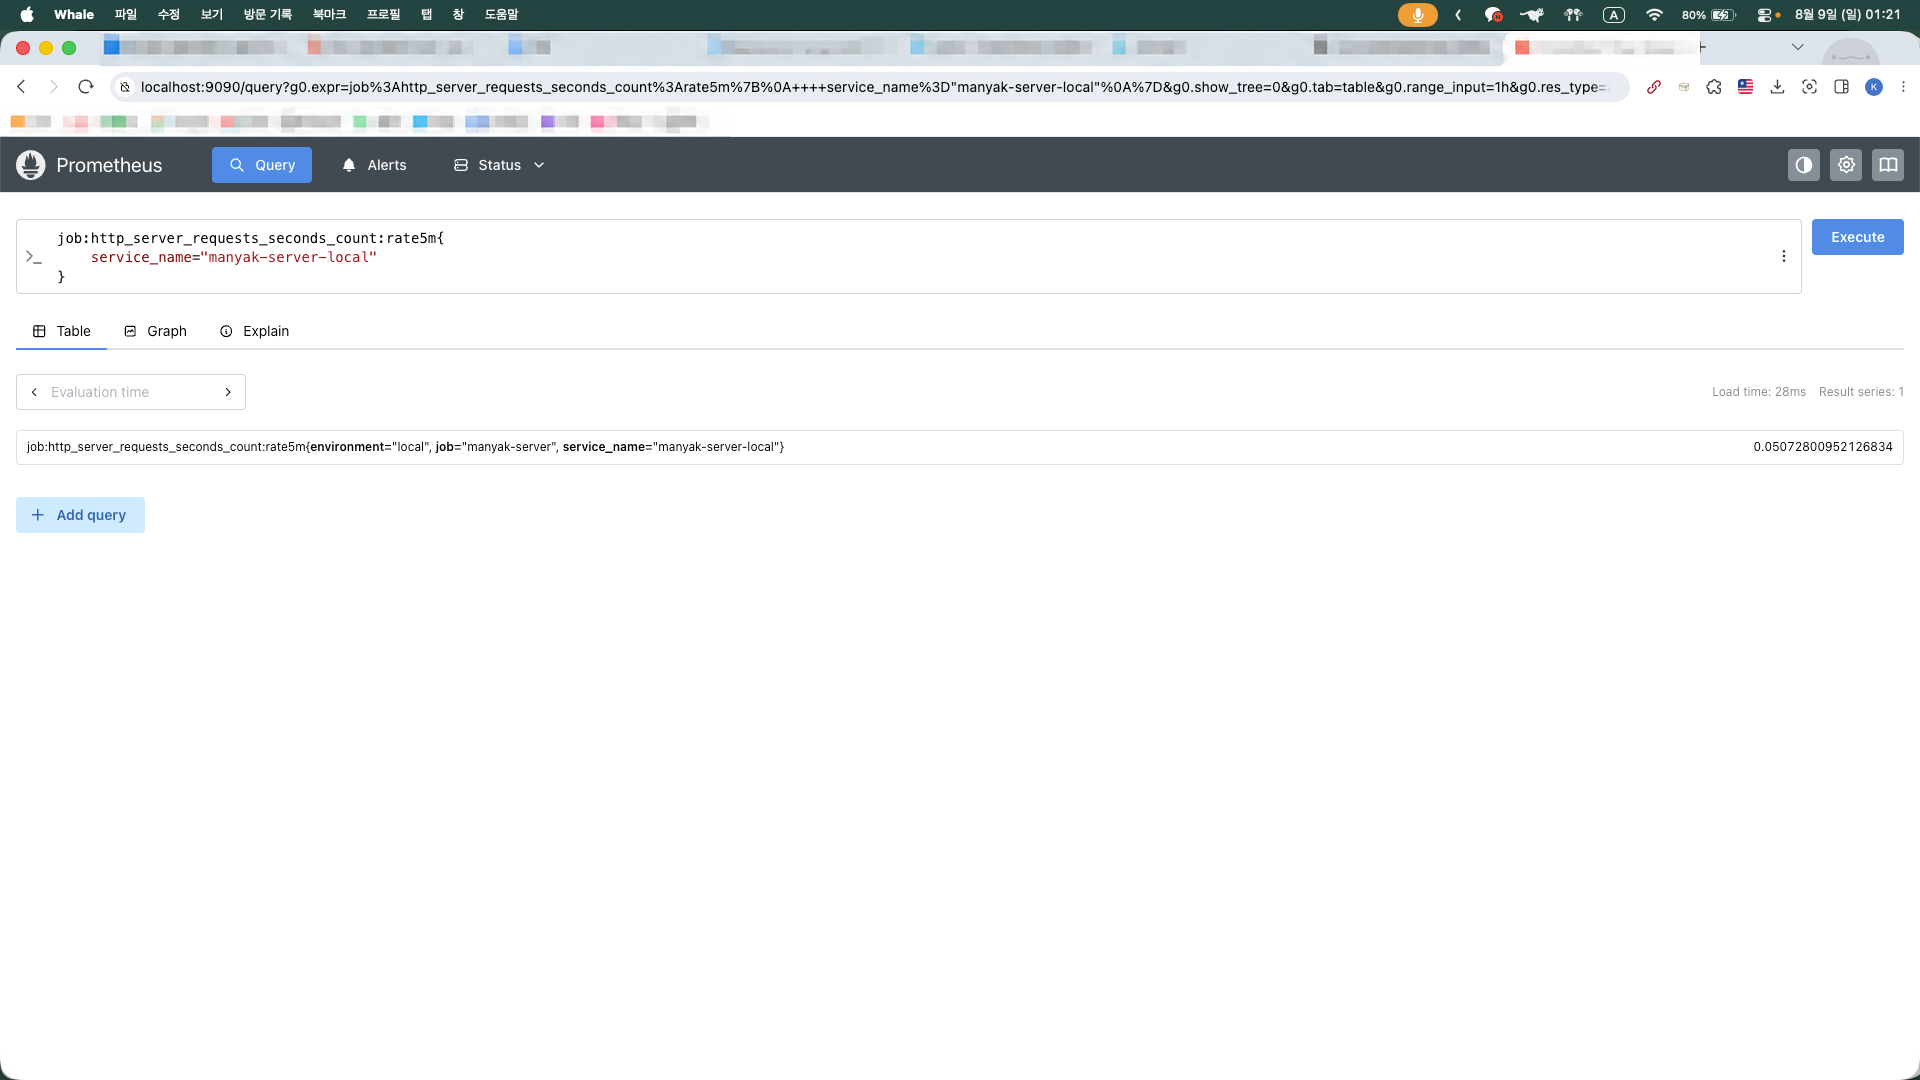
결과는 약 0.0507이었다. 이 값은 누적 요청 수나 백분율이 아니라 초당 요청 수다.
0.0507 request/second × 60 seconds
= 약 3.04 request/minute
별도 트래픽을 만들지 않아도 Docker healthcheck와 직접 실행한 요청이 있으므로 값이 0보다 클 수 있다. 최근 5분 이동 구간을 사용하기 때문에 요청을 멈춰도 즉시 0이 되지 않고 이전 샘플이 범위 밖으로 빠지면서 감소한다.
결과에서 instance 라벨이 사라진 것도 의도한 동작이다. sum by (job, service_name, environment)가 지정한 세 라벨만 남기고 URI, method, status와 instance를 합쳤기 때문이다. 인스턴스별 요청률이 필요하다면 sum by에 instance를 추가해야 한다.
로컬과 운영의 Timer 메트릭 이름에는 단위 차이도 있었다. /actuator/prometheus에서는 _seconds_*로 노출되지만 같은 Micrometer Timer가 Grafana Cloud에는 _milliseconds_*로 수신됐다.
로컬 pull: http_server_requests_seconds_count
운영 OTLP:  http_server_requests_milliseconds_count
Relabel로 라벨 구조를 비슷하게 만들더라도 수집 방식에 따른 단위 변환까지 같아지는 것은 아니다. 로컬 PromQL을 운영 대시보드로 옮길 때는 실제 수신된 메트릭 이름과 단위를 확인해야 한다.
정리
로컬 Docker Compose에 Prometheus를 추가해 Spring Boot 메트릭의 scrape, relabel, 저장, recording rule 평가 과정을 직접 확인했다. 운영은 기존 OTLP push 방식을 유지하고 /actuator/prometheus는 local 프로파일로 제한했다. 설정 파일 검증만으로 끝내지 않고 Target, up, recording rule 결과까지 조회하니 pull 구조에서 각 설정이 어느 단계에 적용되는지 구분할 수 있었다.